Back to Resources
Case study
Exploring New Ways to Improve Australia's Capabilities to Map Floods and Their Impacts
Prof. Stuart Phinn | The University of Queensland, Prof. Noam Levin | Hebrew University of Jerusalem
Case study
July 27, 2023

Global climate changes are increasing the risk of natural disasters and severe flood events. In 2022 , more than 20,000 homes and business were flooded and tens of thousands of people were displaced along Australia’s east coast when a year’s worth of rain hit one of the country’s largest cities, Sydney, in only three months. These types of severe flooding events are expected to become only more common and will require more comprehensive disaster response and mitigation planning.
Disaster response requires timely information on the extent(s) of the events itself, including the flooded areas and houses cut off from roadways. The International Charter Space and Major Disasters was established in 1999 to provide remotely sensed derived information from charter members to countries in need of data for emergency response. Since then both NASA and the European Space Agency have developed flood products – spatial datasets of flooded areas based on optical satellites which they operate.
However, there are some significant disadvantages to only relying on image data from optical satellites. Flood events are often associated with persistent cloud cover, which hampers the mapping of flooded areas by satellites operating in the visible and infrared spectral ranges. Satellite revisit is also a challenge. The time it takes for satellites to image the same area can range between five minutes for geostationary meteorological satellites - low-spatial resolution weather satellites that cover large areas - to more than a week for commonly used environmental monitoring satellites, such as the Landsat and Sentinel Series. Frequent revisit times, ideally once an hour, are needed to increase the likelihood of collecting satellite images of an area when the ground is not obscured by cloud. This is even more crucial in the case of flooding events within urban areas, where flooded areas are smaller and are often flooded for shorter time periods, than in rural areas.
To demonstrate the possibilities offered by new satellites, Professor Stuart Phinn of the University of Queensland and Professor Noam Levin of the Hebrew University of Jerusalem trialed the use of three different sensors (optical, imaging radar, and night-time light data) to map areas impacted by the February and March 2022 floods in Brisbane and southeast Queensland, Australia. Situated on the flood plain of the Brisbane River, many suburbs of Brisbane are located in flood-prone areas, with noticeable historical flood events taking place in 1841, 1893, 1974, and 2011. Between 22 Feb and 9 Mar 2022, more than 50 sites in southeast Queensland recorded more than 1 meter of rain in the week ending on 1 Mar 2022, while in Brisbane there were three consecutive days with more than 250 mm/day (a local record breaker). For many stations in Brisbane and the surrounding areas, river flood height reached their peak on 28 Feb 2022.
Prof. Phinn and Prof. Levin used a pair of optical images, to map inundated areas in Brisbane, comparing pre-flood images (9 and 17 Feb 2022) and an image acquired during peak flood (28 Feb 2022). They were able to map the flooded areas in Brisbane within a few days of the event itself. However, some areas were covered by clouds and could not be mapped using this approach.
To address this, the researchers used imaging radar data from the Capella constellation of satellites, which is able to collect images of the earth’s surface through cloud and smoke, at any time of day or night. Imaging radar sensors do not rely on reflected sunlight or thermal energy to image the earth’s surface. Capella operates a constellation of commercial imaging radar satellites, which allows high revisit rates of areas of interest globally, at a spatial resolution of less than 0.50 m. They had access to a Capella image covering part of Brisbane during peak flood (28 Feb 2022).
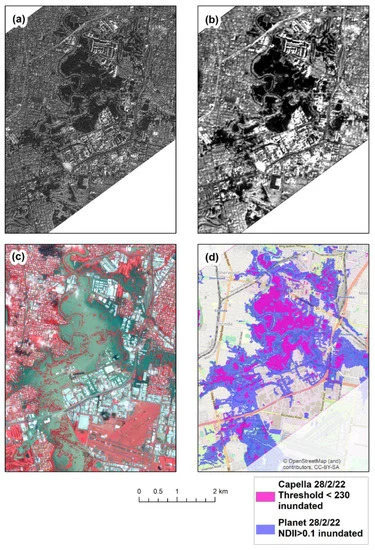
While water receded relatively fast in Brisbane (within 3-4 days), some impacts of the flood were visible from space for longer periods. These included impacts on the provision of electricity. NASA’s VIIRS Day and Night Band (DNB) offers global nightly imagery of light at night – emissions of artificial lights, which are known as a good proxy for human activity. Although the spatial resolution of VIIRS is coarse (750 m), and in spite of this optical sensor being limited by cloud cover as well, Prof. Phinn and Prof. Levin were able to identify areas where night lights brightness had decreased significantly, comparing the pre-flood dates and the post-flood period. These areas matched very well with the mapping they performed using the optical and Capella data, and with areas reported in the news as being flood affected. These impacted areas also matched with decreases in electricity loads reported by Energex, the regional electricity provider. Using time series of night lights thus enables researchers to monitor and map both the impact of floods (or other natural disasters) on human activity and livelihood, and the recovery of such crucial services to the public following the flood.
Collaborative work on multi-sensor, ground instrument and modelling approaches across industry, universities and governments will help develop more effective flood extent mapping and prediction. While modelling can assess which areas are more likely to be impacted, actual observations from satellites may offer direct measure of the areas where help is most needed. There is opportunity for industry and government to partner in order to develop and deliver more effective services for flood monitoring.
Read more online – Assessing the 2022 Flood Impacts in Queensland Combining Daytime and Nighttime Optical and Imaging Radar Data https://www.mdpi.com/2072-4292/14/19/5009
Source: https://disasterphilanthropy.org/disasters/2022-australian-flooding/ [SP1]
Curious Which Of Our Analytics Partners
Can Support Your Mission?
Contact our team to explore the possibilities. Our experts can help
you determine the optimal solutions for your unique needs.

Keywords
.png)
Stay Informed. Stay Ready.
Get briefings on new capabilities, technology improvements, and upcoming events.


.avif)
