Back to Resources
Case study
Using SAR Data to Monitor the Impacts of Illegal Mining in Istmina, Colombia
Capella Space
Case study
August 3, 2021

Illegal mining in Latin America has had devastating effects on forests and river channels, leading to negative downstream impacts on the health of local people, flora and fauna. The increase in the international price of gold has spurred the spread of illegal mining, attracting thousands to the region. The main problem with illegal mining is the indiscriminate and irresponsible use of elements such as mercury and cyanide, which are poisonous and endanger the environment.
In Colombia, 66% of alluvial gold mining is illegal. The highest rate of illegal mining is in the Chocó department, according to the United Nations Office on Drugs and Crime (UNODC). Istmina, Colombia is a municipality located in the department of Chocó, in the middle of one of the most valuable forests in the world. This area has been devastated by illegal mining.
In recent years, efforts have been made to monitor and fight this activity by using optical satellite imagery. However, most of the areas being mined are prone to dense and near-constant cloud cover, preventing optical imagery from being used to keep local enforcement informed. The use of synthetic aperture radar (SAR) data has become increasingly popular in recent years because of its advantages over traditional sensors, particularly its ability to obtain information through clouds both day and at night. Geospace Solutions in Ecuador, a distributor of ENVI software, undertook a study to evaluate the use of high-resolution SAR data to accurately monitor and quantify the illicit exploitation of gold in Istmina.
METHODS AND PRODUCTS
The study was performed using ENVI SARscape®, the leading SAR processing and analysis software from L3Harris Geospatial, and SAR data from Capella Space. Capella currently has the industry’s highest resolution SAR data with the most frequent revisit rates. The goal of the study was to monitor change over time in the area of interest to measure the impacts of illegal mining.
The Capella SAR data used in this study was GEO (geocoded) products, acquired in Stripmap (SM) and Spotlight (SP) mode, in HH co-polarization obtained by the Capella Constellation, in ascending geometry.
The SAR data for the study has the following characteristics:
The multi-temporal SAR data was acquired:
- October 22, 2020 (SM)
- November 4, 2020 (SM)
- November 10, 2020 (SM)
- November 30, 2020 (SM)
- December 14, 2020 (SP)
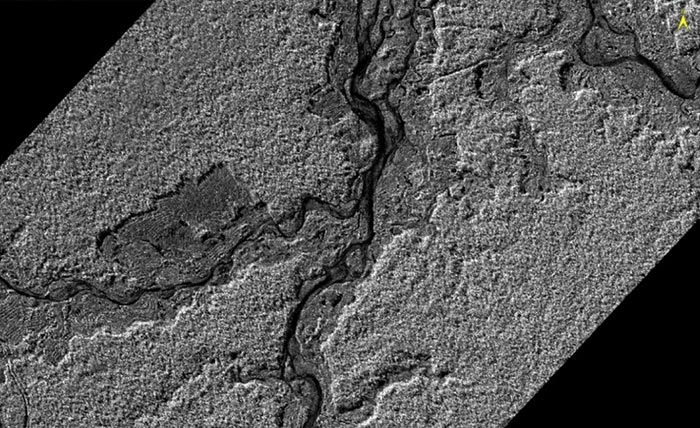
Prior to processing and analyzing the SAR data, the images already show the devastation that has occurred to this area. The contrast between the forest areas (light gray) and the areas without vegetation (dark gray) is noticeable. Because Istmina has been exploited for many years, the challenge was to verify if there were new deforested areas that would indicate recent activity as well as identify the presence of heavy machinery and infrastructure that are used in the exploitation of minerals.
SAR MULTI-TEMPORAL FEATURES
Multi-temporal features based on first-order statistics were derived from SAR intensity data using ENVI SARscape. The goal of the analysis of the Capella images in Stripmap mode was to detect and extract temporary changes.
The first-order statistics calculated from the SAR input data are:
- Mean: Represents the average calculated from all input data.
- Standard Deviation: Represents the standard deviation calculated from all input data.
- Median: Represents the median value (the central value in the ordered series) calculated from all input data.
- Gradient: Represents the maximum absolute variation between consecutive acquisition dates.
- Maximum Value: Represents the maximum value extracted from all input data.
- Minimum Value: Represents the minimum value extracted from all input data.
- Span Difference: Represents the difference between the maximum value and the minimum value of all input data.
- Maximum increment: Represents the maximum increase between consecutive acquisition dates.
- Maximum decrement: Represents the maximum decrease between consecutive acquisition dates.
- Span Ratio: Represents the ratio calculated between the maximum value and the minimum value of all input data.
- Maximum ratio: Represents the maximum value (maximum backscatter increment) among all ratios calculated between consecutive acquisition dates.
- Minimum Ratio: Represents the minimum value (maximum backscatter decrement) among all ratios calculated between consecutive acquisition dates.
- MuSigma: Represents the mean/standard deviation ratio.
- Coefficient of variation: Represents the standard deviation/mean ratio.
- Mode: Represents the mode value (the value which appears more often in the input series) calculated from all input data.
To represent the dynamics of change, the SAR multi-temporal analysis of characteristics shows an RGB color composition:
- R: Gradient
- G: Minimum Value
- B: Coefficient of variation
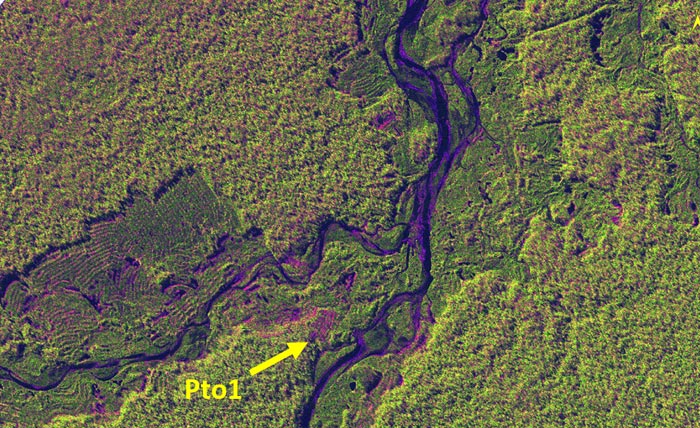
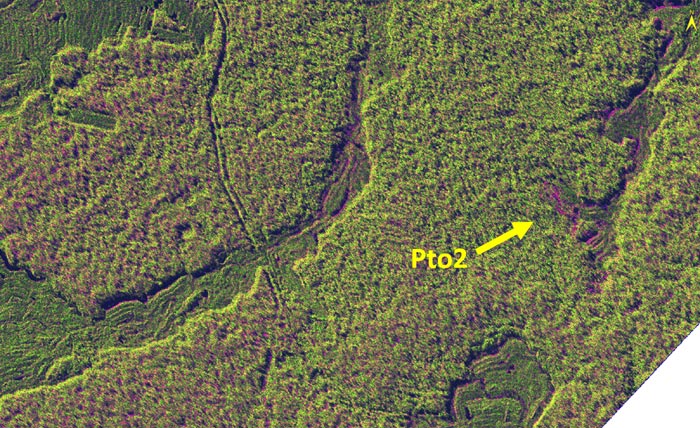
In this color image, the magenta tones indicate the areas with higher change dynamics that have occurred in the analysis time window from October 22 to November 30, 2020.

TEXTURE ANALYSIS
In general, texture refers to the spatial variation of the gray levels (tone) of the image as a function of the scale. In the case of SAR data, the texture provides a new level of information to interpret and extract features of interest.
Metrics were used to apply a texture filter that was based on a first-order measure of occurrence. The metrics calculated on the SAR data in spotlight mode were:
- Data range: Represents the maximum value minus the minimum value in the kernel.
- Mean: Represents the average value of the kernel.
- Variance: Represents a measure of the dispersion of the values around the mean.
- Entropy: Represents a measure of the disorder of the kernel values.
- Skewness: Represents a measure of symmetry around the mean
Texture analysis with high resolution SAR data allowed us to highlight characteristics and details of the data through a false RGB color composition, where:
- R: Data range
- G: Mean
- B: Variance

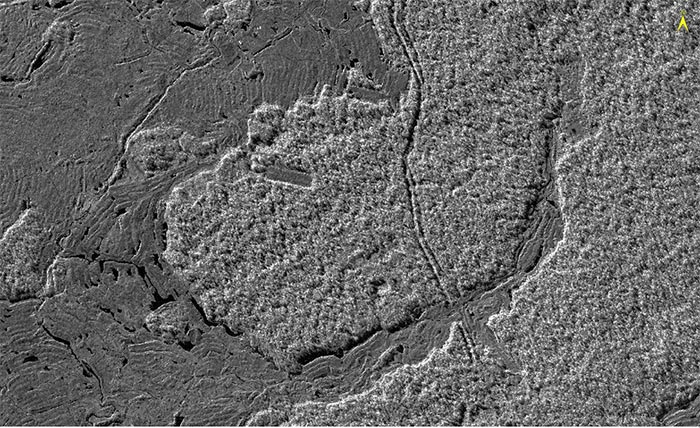
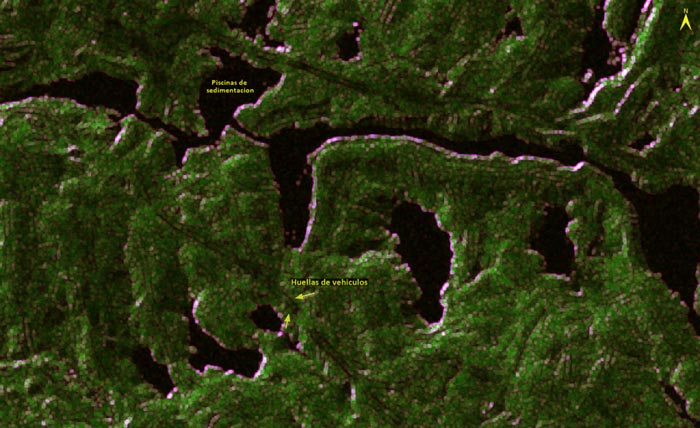
In this false color image, we can identify and enhance important elements such as the sedimentation pools in black and the infrastructure and machinery present in the area on the date the image was collected (December 14, 2020) in white. This allowed us to better understand the dynamics that are occurring due illegal mining in detail.
RESULTS
Once the SAR intensity time series was obtained from multi-temporal data acquired in Stripmap mode, new activity was detected in the following coordinates Pto1: 5 ° 13'29.67 "N, 76 ° 43'23.98" W,
Additionally, the construction of new sedimentation pools was identified at the coordinate Pto2: 5 ° 11'56.88 "N, 76 ° 43'48.39" W.
As a result of the texture analysis of the SAR image in spotlight mode, unique details of the mining activity were identified such as the footprint of the loading vehicles that extract the material as shown in the following figure:
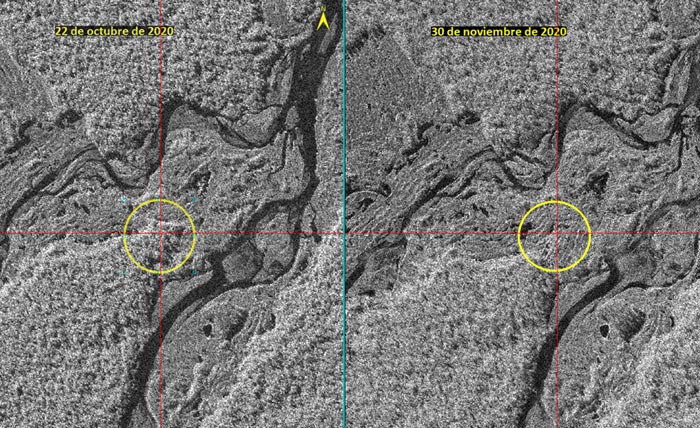
The visual comparison between the data collected on October 22, and the data collected on November 30, (38 days later), validates our deforestation identification results as shown in the following figure:
Further, visual validation was carried out between the multi-temporal data where mining activities are evidenced as shown below:

The Spotlight data also allowed us to clearly identify infrastructure elements such as camps and machinery as seen below:

CONCLUSIONS
The Istmina municipality in Colombia, like many other places in the region where illegal mining activities take place, is located in an area with complex climate conditions. These conditions facilitate the development and spread of illegal mining activity due to the lack of permanent monitoring systems that allow for surveillance and enforcement. SAR data provides the right solution for this problem with its ability to “see” through the clouds and operate both day and night.
The very high-resolution SAR Capella data used in this study demonstrate that with its improved radiometry technology and low noise, it is possible to overcome the limitations of optical data, eliminating the myth of target identification as a unique capability of traditional sensors.
The advantages of Capella's SAR data combined with ENVI SARscape allowed the processing of a time series analysis of SAR intensity. This gives us a terrific understanding of the dynamics of change and the phenomena underway in the illegal mining area, proving that at the present time the area is still being exploited. The texture analysis of SAR data magnifies its advantages by identifying different types of coverage and highlighting elements of interest to better understand the phenomenon of illegal mining. This information will allow for faster and more informed decisions and the implementation of efficient monitoring systems that support government policies to stop this activity that has already caused so much damage to these territories. To learn more about how SAR can extract economic, environmental and geopolitical insights, contact us.
References
Curious Which Of Our Analytics Partners
Can Support Your Mission?
Contact our team to explore the possibilities. Our experts can help
you determine the optimal solutions for your unique needs.

Keywords

.png)
Stay Informed. Stay Ready.
Get briefings on new capabilities, technology improvements, and upcoming events.


.avif)
